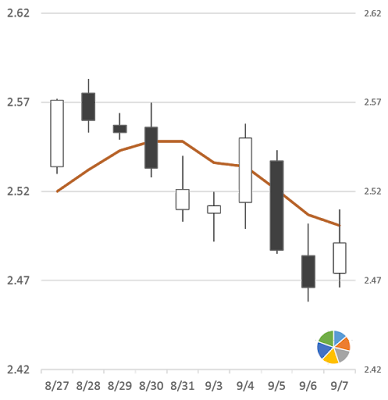
This is a positive action of traders, hoping to grasp the behavior of the market changing at any time. Most people who are new to trading like this feeling, but little attention is paid to the slow-moving object, the moving average.
However, from the aspect of stability, it is because of the slow change of the moving average, which makes the stability of the moving average strong. For the facts of transactions that have occurred, the information depicted by the moving averages is more informative than the candlestick.
【example】
The picture above is a Candle stick chart. On the next trading day, if a candle is formed as shown below:
So which direction will the next moving average be developed?
This is a situation where the surface looks very easy to answer and the actual situation may vary greatly.
{Scenario 1}
{Scenario 2}
If the price fluctuations on the new trading day are as shown in the figure, then on the Candle stick chart, the graph of the average price upward may not be available.
[Thinking] Why is it easy for traders to put too much time and thinking on the observation of price fluctuations?
More articles, please see "English version index"


没有评论:
发表评论