
2018年12月31日星期一
All year Market fluctuations ( China's mainland stock market in 2018 )
All year Market fluctuations ( China's mainland stock market in 2018 )


2018年12月30日星期日
Comparison of strengths and weaknesses of stocks in China mainland in December 2018.
Comparison of strengths and weaknesses of stocks in China mainland in December 2018.


2018年12月28日星期五
Market fluctuations in China's mainland stock market in December2018
December 2018
Market fluctuations in China's mainland stock market

Market fluctuations in China's mainland stock market

2018年12月27日星期四


2018年12月25日星期二
3.6.2 Suggestions on establishing a trading strategy (2)
End with a "relatively good" strategy
After the trader removes the "not good strategy", there will be some good strategies left behind with the culling strategy. Traders need to make trade-offs to settle their relatively good strategies to meet their investment requirements. However, many traders are not satisfied with this and hope to find a better or even "perfect" trading strategy.
But as discussed at the beginning of this chapter (see 3.1.1), no single strategy is flawless, because a flawless strategy can make assets expand and produce amazing results. This phenomenon has not been seen in the real trading environment.
A strategy of pursuing perfection can cause damage to traders. This sentence sounds a bit unreasonable, but it is true because:
Therefore, once a trader has worked hard to develop a "perfect" strategy, this means that the trader always reminds himself that he may spend the same hard time modifying the strategy at any time in the future.

If a trader changes the demanding requirements of the “strategy” and can accept the “strategy” to some extent, then the tested strategy will not let the trader be in a state of tension to modify the strategy.
This is what this article calls a "relatively good" strategy.
More articles, please browse "English version"
After the trader removes the "not good strategy", there will be some good strategies left behind with the culling strategy. Traders need to make trade-offs to settle their relatively good strategies to meet their investment requirements. However, many traders are not satisfied with this and hope to find a better or even "perfect" trading strategy.
But as discussed at the beginning of this chapter (see 3.1.1), no single strategy is flawless, because a flawless strategy can make assets expand and produce amazing results. This phenomenon has not been seen in the real trading environment.
A strategy of pursuing perfection can cause damage to traders. This sentence sounds a bit unreasonable, but it is true because:
- When a trader develops a so-called "perfect" strategy, the strategy is revisited in the event of an undesirable effect in the process of testing with historical data of selectable multiple samples. Once the strategy is revised, it needs to be re-verified. Repeating this way may result in a huge amount of work and consume a lot of time and effort of the trader.
- Once a "perfect" strategy has been put into practice through the test of multiple sample historical data, and the subsequent reality is very likely to make the strategy invalid at some point in time, the trader needs to be revised. Strategy and test to meet the "perfect" needs. This may once again create a massive amount of work, continuing to consume a lot of time and effort on the trader.
Therefore, once a trader has worked hard to develop a "perfect" strategy, this means that the trader always reminds himself that he may spend the same hard time modifying the strategy at any time in the future.

If a trader changes the demanding requirements of the “strategy” and can accept the “strategy” to some extent, then the tested strategy will not let the trader be in a state of tension to modify the strategy.
This is what this article calls a "relatively good" strategy.
More articles, please browse "English version"
3.6.2 关于建立交易策略的建议(2)
止于“相对好”的策略
交易者在对“不好的策略”进行剔除后,会剩余一些相对于剔除的策略而留下的好的策略。交易者对于留下的相对好的策略,需要有所取舍,以满足自己的投资要求。不过很多交易者不满足于此,希望找到更好的甚至是“完美”的交易策略。
不过正如本章开始所探讨的那样(详见3.1.1),没有哪一个策略是完美无瑕的,因为完美无瑕的策略会让资产扩张起来产生惊人的效果,而在现实的交易环境中没有普遍的看到这样的现象。
追求完美的策略会造成对交易者的伤害。这句话听起来有些不合情理,不过事实的确如此,原因在于:
因此,一旦交易者通过艰辛的努力研究出某个“完美”的策略,那么这就意味着交易者时刻都要提醒自己随时可能在将来再耗费同样的艰辛修改此策略。

交易者如果改变对“策略”的苛刻要求,能够接受“策略”在某种程度上带来的损失,那么经过检验后的策略不会让交易者时刻处于要修改策略的紧张状态中。
这就是本文所谓的止于“相对好”的策略。
交易者在对“不好的策略”进行剔除后,会剩余一些相对于剔除的策略而留下的好的策略。交易者对于留下的相对好的策略,需要有所取舍,以满足自己的投资要求。不过很多交易者不满足于此,希望找到更好的甚至是“完美”的交易策略。
不过正如本章开始所探讨的那样(详见3.1.1),没有哪一个策略是完美无瑕的,因为完美无瑕的策略会让资产扩张起来产生惊人的效果,而在现实的交易环境中没有普遍的看到这样的现象。
追求完美的策略会造成对交易者的伤害。这句话听起来有些不合情理,不过事实的确如此,原因在于:
- 当交易者制定了所谓的“完美”的策略后,在利用可选择的多个样本的历史数据进行检验的过程中,一旦出现不理想的效果,就会重新修订该策略。而一旦重新修订策略,那么需要重新检验此策略。这样反复下去,可能会形成海量工作,并消耗交易者大量的时间和精力。
- 一旦某个“完美”策略通过了多个样本历史数据的检验开始付诸于实际操作,而接下来发生的现实情况极有可能让该策略在某个时间点失效,此时交易者需要重新修订策略,并检验以符合“完美”的需要。这可能又一次形成海量工作,继续消耗交易者大量的时间和精力。
因此,一旦交易者通过艰辛的努力研究出某个“完美”的策略,那么这就意味着交易者时刻都要提醒自己随时可能在将来再耗费同样的艰辛修改此策略。

交易者如果改变对“策略”的苛刻要求,能够接受“策略”在某种程度上带来的损失,那么经过检验后的策略不会让交易者时刻处于要修改策略的紧张状态中。
这就是本文所谓的止于“相对好”的策略。
更多文章,请浏览“中文版目录”
2018年12月20日星期四
3.6.1 Suggestions on establishing a trading strategy (1)
Every trader wants to establish their own personalized trading strategy, so the established trading strategy will vary from person to person, and the difference between these trading strategies is bigger or smaller. For example, two traders are based on MACD to establish their own trading strategy. If the parameters adopted by the two people are different, then the difference is very small; if one trader adopts the trading strategy of MACD technology analysis and another trade Using the fundamentals of financial indicators to analyze trading strategies, the difference between the two trading strategies is large.
Therefore, this article can not give a detailed discussion on the specific content of the trading strategy, and can only discuss the starting point and purpose of the entire trading strategy.
Thinking from a "not good strategy"
The so-called "not good strategy" means that when a trader chooses a specific strategy, the strategy is not suitable for the trader.
“Good” and “not good” are relative concepts. Different traders, investment ideas and investment plans will make the same strategy produce different value judgments between different traders.
When traders develop their own trading strategies, they generally prefer to start thinking from the perspective of “good strategy”, and when considering this purpose, they unconsciously hope that this “good strategy” can “completely” avoid various kinds. risk. Thinking for this purpose is risky for most traders. At the beginning of this chapter, we explored that this strategy is not universal, but most traders will believe that they have the ability to master a "good strategy" that others cannot master. This has caused many traders to fall into this category--the "good strategy" of "completely" avoiding risks is in pursuit.

Once a trader is caught in a “good strategy” pursuit of “completely” avoiding risk, it will cause some harm to the trader:
If the trader changes the starting point of the trading strategy and starts to study from the "not good strategy", this stage can not get the active guidance of the action, but it can produce another effect: let yourself realize that in many cases You should not behave arrogantly.
From the negative way as a starting point for thinking, traders can effectively isolate themselves from “not good” strategies. For example, when a trader prepares a portion of the funds to trade in financial products, he has begun to give the business a "long-lasting good" vision in the depths of the trader's consciousness. But once the funds are ready for the transaction, some "strategies" are inadvertently pushed to the traders - for example, "the average price on the 10th goes from falling to buying, and the average price on the 10th is changed from rising to falling." Such a strategy. Once the trader begins to feel that the strategy is effective, then the investable variety will come one after another. As traders continue to buy, they suddenly find that their funds are not enough, and they are quickly occupied by a large number of trading products, and then continue to emerge. The exhaustion of funds in a short period of time contrasts with the vision of “long-term beauty”. On the one hand, traders will give unrealistic wishes to the currently traded varieties, and on the other hand, short-term quick actions will disrupt long-term planning.
When traders start with long-term planning, once they encounter short-term strategies, it is probably a good strategy to consider this strategy first, but for their long-term plans, this is a "not good strategy" and should be avoided. use.
This way of thinking about the starting point can be a good protection for traders.
For example, the following ways of thinking:
This way of thinking will make traders feel that certain conditions constrain their own transactions, but it is these constraints that effectively protect traders in many cases.
(to be continued...)
For more articles, please browse "English version index"
Therefore, this article can not give a detailed discussion on the specific content of the trading strategy, and can only discuss the starting point and purpose of the entire trading strategy.
Thinking from a "not good strategy"
The so-called "not good strategy" means that when a trader chooses a specific strategy, the strategy is not suitable for the trader.
“Good” and “not good” are relative concepts. Different traders, investment ideas and investment plans will make the same strategy produce different value judgments between different traders.
When traders develop their own trading strategies, they generally prefer to start thinking from the perspective of “good strategy”, and when considering this purpose, they unconsciously hope that this “good strategy” can “completely” avoid various kinds. risk. Thinking for this purpose is risky for most traders. At the beginning of this chapter, we explored that this strategy is not universal, but most traders will believe that they have the ability to master a "good strategy" that others cannot master. This has caused many traders to fall into this category--the "good strategy" of "completely" avoiding risks is in pursuit.

Once a trader is caught in a “good strategy” pursuit of “completely” avoiding risk, it will cause some harm to the trader:
- When the strategy is effective at a certain stage, the trader will downplay the risk control, which makes the trader forget the discipline in the use of funds;
- When the strategy fails at a certain stage, the trader will be confused, which makes the funds slowly lose the security barrier;
- When the strategy fails for a long time, the trader will fall into pain, which makes the rational analysis and independent thinking disappear;
- When the strategy fails for a longer period of time, the trader pays more time for this.
If the trader changes the starting point of the trading strategy and starts to study from the "not good strategy", this stage can not get the active guidance of the action, but it can produce another effect: let yourself realize that in many cases You should not behave arrogantly.
From the negative way as a starting point for thinking, traders can effectively isolate themselves from “not good” strategies. For example, when a trader prepares a portion of the funds to trade in financial products, he has begun to give the business a "long-lasting good" vision in the depths of the trader's consciousness. But once the funds are ready for the transaction, some "strategies" are inadvertently pushed to the traders - for example, "the average price on the 10th goes from falling to buying, and the average price on the 10th is changed from rising to falling." Such a strategy. Once the trader begins to feel that the strategy is effective, then the investable variety will come one after another. As traders continue to buy, they suddenly find that their funds are not enough, and they are quickly occupied by a large number of trading products, and then continue to emerge. The exhaustion of funds in a short period of time contrasts with the vision of “long-term beauty”. On the one hand, traders will give unrealistic wishes to the currently traded varieties, and on the other hand, short-term quick actions will disrupt long-term planning.
When traders start with long-term planning, once they encounter short-term strategies, it is probably a good strategy to consider this strategy first, but for their long-term plans, this is a "not good strategy" and should be avoided. use.
This way of thinking about the starting point can be a good protection for traders.
For example, the following ways of thinking:
- Don't buy stocks that have a record high (although it's tempting and may even be more attractive in the future).
- Don't buy stocks that have a record low (although it's cheap, maybe it's cheaper in the future).
- Don't buy stocks that are losing money (although the market reports that it will turn losses, but it is not true after all).
- Don't buy stocks that haven't paid dividends for many years (although it's good, but it's not for shareholders).
- The price breaks through the xx day pressure line and does not buy (although the price has broken through, the long-term investment behavior is not based on the price breakthrough on a certain day)
- ...
This way of thinking will make traders feel that certain conditions constrain their own transactions, but it is these constraints that effectively protect traders in many cases.
(to be continued...)
For more articles, please browse "English version index"
2018年12月19日星期三
3.6.1 关于建立交易策略的建议(1)
每一个交易者都希望建立自己的交易策略,因此使得建立的交易策略会因人而异,这些交易策略之间的差别或大或小。例如两个交易者都是基于MACD建立起自己的交易策略,如果二人采取的参数有所差异,那么这种区别就十分微小;而如果一个交易者采用MACD技术分析的交易策略而另一个交易者采用财务指标的基本面分析交易策略,那么这两种交易策略之间的差异就很大了。
因此本文对交易策略的具体内容无法给予详细的论述,只能就整个交易策略建立的出发点和目的做一些探讨。
从“不好的策略”开始思考
所谓“不好的策略”是指当一位交易者对某个具体策略进行选择时,该策略不适合这位交易者。
“好”与“不好”是相对的概念,因交易者不同、投资理念和投资计划不同会使得同一个策略在不同的交易者之间产生相异的价值判断。
交易者在制定自己的交易策略时,一般偏向于从“好的策略”这样的角度开始思考,并且在考虑这个目的时,不自觉地希望这个“好的策略”可以“完全”避开各种风险。抱着这样的目的进行思考对于大多数交易者而言是有风险的。本章一开始就探讨了这种策略不具备普遍性,可是大多数交易者在内心深处会相信自己有能力掌握一种他人无法掌握的“好的策略”,这使得很多交易者陷入对这种“完全”避开风险的“好的策略”追求中。

一旦交易者陷入对“完全”避开风险的“好的策略”追求,会给交易者带来某些方面的伤害:
如果交易者改变制定交易策略的出发点,转而从“不好的策略”开始研究,这个阶段虽然无法获得行动上的主动指引,但是却可以产生另一个效果:让自己意识到在很多种情况下不应该莽撞行事。
从否定方式作为思考的出发点,交易者可以有效的同“不好”的策略进行隔绝。例如当交易者准备了一部分资金希望从事金融产品的交易时,在交易者意识的深处已经开始对这项事业给予了一个“长久美好”的愿景。但资金一旦为交易做好准备,某些“策略”不经意间就推送到交易者面前——例如“10日平均价格从下跌转入上升买入,10日平均价格由上升转入下跌卖出”这样的策略。一旦交易者开始觉得该策略有效,那么可投资品种接踵而至的到来,目不暇接。随着交易者不断买入,突然发现自己的资金不够用了,很快被大量交易品种占据,而接下来还在不断涌现。短时间资金的耗尽同“长久美好”的愿景形成反差。一方面交易者会给予当前所交易品种不切实际的愿望,另一方面短期快速行为打乱了长久的计划安排。
当交易者一开始有长远规划时,一旦遇到短期策略,首先要考虑这种策略可能是一个好的策略,但是对于自身的长远计划来说,这是一个“不好的策略”,应该避免使用。
这样思考出发点对交易者可以起到很好的保护作用。
例如以下的思考方式:
以上这种思考方式,会让交易者觉得某些条件对自己的交易产生了约束,但是正是这些约束在很多情况下会有效地保护了交易者。
因此本文对交易策略的具体内容无法给予详细的论述,只能就整个交易策略建立的出发点和目的做一些探讨。
从“不好的策略”开始思考
所谓“不好的策略”是指当一位交易者对某个具体策略进行选择时,该策略不适合这位交易者。
“好”与“不好”是相对的概念,因交易者不同、投资理念和投资计划不同会使得同一个策略在不同的交易者之间产生相异的价值判断。
交易者在制定自己的交易策略时,一般偏向于从“好的策略”这样的角度开始思考,并且在考虑这个目的时,不自觉地希望这个“好的策略”可以“完全”避开各种风险。抱着这样的目的进行思考对于大多数交易者而言是有风险的。本章一开始就探讨了这种策略不具备普遍性,可是大多数交易者在内心深处会相信自己有能力掌握一种他人无法掌握的“好的策略”,这使得很多交易者陷入对这种“完全”避开风险的“好的策略”追求中。

一旦交易者陷入对“完全”避开风险的“好的策略”追求,会给交易者带来某些方面的伤害:
- 策略在某个阶段有效时,交易者会淡化风险控制,这使得交易者在资金的使用上忘记了纪律;
- 策略在某个阶段失效时,交易者会陷入迷茫,这使得资金慢慢失去安全的屏障;
- 当策略长时间失效时,交易者会陷入痛苦,这使得理智分析和独立思考消失;
- 当策略更长时间失效时,交易者为此付出了更多时间的代价。
如果交易者改变制定交易策略的出发点,转而从“不好的策略”开始研究,这个阶段虽然无法获得行动上的主动指引,但是却可以产生另一个效果:让自己意识到在很多种情况下不应该莽撞行事。
从否定方式作为思考的出发点,交易者可以有效的同“不好”的策略进行隔绝。例如当交易者准备了一部分资金希望从事金融产品的交易时,在交易者意识的深处已经开始对这项事业给予了一个“长久美好”的愿景。但资金一旦为交易做好准备,某些“策略”不经意间就推送到交易者面前——例如“10日平均价格从下跌转入上升买入,10日平均价格由上升转入下跌卖出”这样的策略。一旦交易者开始觉得该策略有效,那么可投资品种接踵而至的到来,目不暇接。随着交易者不断买入,突然发现自己的资金不够用了,很快被大量交易品种占据,而接下来还在不断涌现。短时间资金的耗尽同“长久美好”的愿景形成反差。一方面交易者会给予当前所交易品种不切实际的愿望,另一方面短期快速行为打乱了长久的计划安排。
当交易者一开始有长远规划时,一旦遇到短期策略,首先要考虑这种策略可能是一个好的策略,但是对于自身的长远计划来说,这是一个“不好的策略”,应该避免使用。
这样思考出发点对交易者可以起到很好的保护作用。
例如以下的思考方式:
- 创出历史新高的股票不要买入(虽然它很诱人,甚至可能将来更诱人)。
- 创出历史新低的股票不要买入(虽然它很便宜,也许将来会更便宜)。
- 企业亏损的股票不要买入(虽然市场报道它会扭亏,但毕竟还不是事实)。
- 企业多年也不分红的股票不要买入(虽然它业绩还不错,但是它不为股东着想)。
- 价格突破xx日压力线不要买入(虽然价格有所突破,但长期投资的行为不是建立在某一天价格突破的基础上)
- … …
以上这种思考方式,会让交易者觉得某些条件对自己的交易产生了约束,但是正是这些约束在很多情况下会有效地保护了交易者。
(待续)
更多文章,请浏览“中文版目录”


2018年12月16日星期日
3.5 Example of the inspection process
The following is an example of a strategy check for a virtual company: Lido Machinery.
During this period, Lido Machinery's stock price fluctuations and MACD changes are shown below.

Its sample data (too much data, only partial data is shown here) as shown below:

After the data is collected, the trader uses the MACD data near the closing time as the basis for buying and selling. After the data is sorted out, the time points for buying and selling are judged by the self-programming rules, as shown in the following figure:
 In the "Operation" column, the calculation and judgment function of the spreadsheet software automatically obtains the time period during which the trading strategy needs to be operated.
On this basis, through the simulation operation, the comprehensive changes of funds at various stages are obtained, and the investment results of the strategy in 2017 on the sample of Lido Machinery are obtained. As shown below (too much data, only partial data is shown here):

As can be seen in the above figure, the trader can track the change of the simulated assets by adding a field similar to “Funds” to understand the actual application effect of the strategy.
More articles, please browse "English version index"
- Sample: Lido Machinery (virtual)
- Trading strategy: buy when MACD>0, sell when MACD<0
- Sample data time period: 2017 (limited to the length of the article, the sample only collects one year of transaction data, in actual applications, the trader will take a longer period of time)
During this period, Lido Machinery's stock price fluctuations and MACD changes are shown below.

Its sample data (too much data, only partial data is shown here) as shown below:

After the data is collected, the trader uses the MACD data near the closing time as the basis for buying and selling. After the data is sorted out, the time points for buying and selling are judged by the self-programming rules, as shown in the following figure:

On this basis, through the simulation operation, the comprehensive changes of funds at various stages are obtained, and the investment results of the strategy in 2017 on the sample of Lido Machinery are obtained. As shown below (too much data, only partial data is shown here):

As can be seen in the above figure, the trader can track the change of the simulated assets by adding a field similar to “Funds” to understand the actual application effect of the strategy.
More articles, please browse "English version index"
2018年12月15日星期六
3.5 检验过程范例
以下内容是针对虚拟的公司利多机械进行某种策略检验的范例。

其样本数据(数据过多,这里只显示部分数据)如下图所示:

数据采集后,交易者采用临近收盘时间点MACD数据作为建仓和清仓的依据。数据经过整理后,通过自编的运算规则判断出买入和卖出的时间点,如下图所示:

其中在“操作提醒”一列,通过电子表格软件的计算和判断功能,自动获得交易策略需要操作的时间段。
在此基础上,通过模拟运算得出资金在各个阶段综合的变化,用以获得该策略在利多机械这个样本上2017年的投资结果。如下图所示(数据过多,这里只显示部分数据):

- 样本:利多机械(虚拟)
- 交易策略:MACD>0时买入,MACD<0时卖出
- 样本数据时间段:2017年(限于文章篇幅,范例只采集一年的交易数据,在实际应用中,交易者会采取更长的时间段)

其样本数据(数据过多,这里只显示部分数据)如下图所示:

数据采集后,交易者采用临近收盘时间点MACD数据作为建仓和清仓的依据。数据经过整理后,通过自编的运算规则判断出买入和卖出的时间点,如下图所示:

其中在“操作提醒”一列,通过电子表格软件的计算和判断功能,自动获得交易策略需要操作的时间段。
在此基础上,通过模拟运算得出资金在各个阶段综合的变化,用以获得该策略在利多机械这个样本上2017年的投资结果。如下图所示(数据过多,这里只显示部分数据):

在上图中可以看出,交易者可以通过再添加类似于“模拟资金变化”这一字段,跟踪模拟资产变化情况,以了解该策略的实际应用效果。
更多文章,请浏览“中文版目录”
2018年12月12日星期三
3.4 Main tools for data inspection
Once the strategy has been developed and the eligible sample data is obtained, the next step is to test whether the strategy is feasible. Regardless of the strategy, what needs to be tested is whether there is revenue around the stage of buying to selling (of course, it may be the stage of selling first and then buying, which usually happens in futures trading).
If the trader relies on manual calculation of the trading process at this time, there will be a problem of "calculation is accurate". This is because when a trader is faced with a large amount of data, it is inevitable that misreading numbers, misplaced decimal points, missing calculations, and improper use of arithmetic rules. For the operation of a large amount of data, the most appropriate method is to complete the computer, which not only ensures the reliability of the data calculation, but also can be quickly calculated by the fast tuning of the strategy.
Testing data through computers presents another problem for traders: they need to be proficient in software that can calculate large amounts of data.
Individual traders generally do not use very specialized software such as databases when processing data because this type of software is too complex and difficult to master for individual traders. The corresponding spreadsheet software is the most suitable tool for personal traders to analyze data. For example, Excel, Numbers and Calc are all spreadsheet software.

In addition to being familiar with the operation of the software, traders need to be familiar with basic arithmetic rules and some logical judgment rules in order to automate the analysis and processing of sample data.
For example, a strategy: when the price-earnings ratio is between 15 and 25 and the MACD is greater than 0, it is bought. Such a sentence may be expressed in a spreadsheet similar to the following:
"PE between 15 and 25" AND "MACD>0"
Let's take a look at the inspection process through an example.
(to be continued)
More articles, please browse "English version index"
2018年12月11日星期二
3.4 数据检验的主要工具
策略制定完毕并且取得符合条件的样本数据后,接下来就是检验策略是否可行的过程。无论是哪种策略,需要检验的都是围绕买入到卖出这一阶段是否有收益而展开(当然也有可能是先卖出再买入的阶段,这通常发生在期货交易上)。
如果此时交易者依赖手工计算其交易过程,会产生“计算是否准确”的问题。这是因为当交易者面对大量数据时,免不了发生看错数字、看错小数点、遗漏计算某个阶段以及运算规则使用不恰当等情况。对于大量数据的运算,最妥善的方法是通过计算机来完成,既保证了数据计算的可靠性,又可以适应策略微调时再次快速运算获得结果。
通过计算机检验数据给交易者带来了另一个问题:对于能够计算大量数据的软件,需要熟练掌握。
个人交易者在对数据进行处理时一般不会采用数据库这类十分专业的软件,因为这种类型的软件对于个人交易者而言功能过于复杂,而且难以掌握。相应的电子表格软件是最符合个人交易者进行数据分析的工具,例如Excel、Numbers和Calc这些软件都属于电子表格软件。
交易者在使用这类软件时,除了要熟悉软件的操作外,还需对基本的算数规则以及一些逻辑判断规则熟练掌握,以便对样本数据做出自动化的分析和处理。

例如某个策略:市盈率介于15至25之间且MACD大于0时则买入。这样一句话在电子表格中可能就表达成类似下面的效果:
PE between 15 and 25 AND MACD>0
下面通过一个范例,对检验过程做一番描述。
(待续)
更多文章,请访问“中文版目录”
2018年12月9日星期日
3.3.3 Inspection strategy (3)
(... continued)
Strategy biased towards technical analysis
When traders have developed a strategy that favors technical analysis, they also face problems similar to those of “strategies that favor fundamental analysis”. It's just that the details are different.
When a trader develops a strategy that favors technical analysis, the first problem that needs to be addressed is how to easily find the eligible data from the historical data of the sample.
Here we assume that the trader's strategy is: the 10-day average price moves from the downtrend to the buy-in time point, and the 10-day average price shifts from the rise to the fall when it is the sell time.
When a trader browses the relevant historical data of Lido Machinery (the company virtualized in this article), it will encounter a large number of data that meets the condition during the stock price fluctuation process of the company, and the data appears to have no time regularity. Therefore, it is necessary to pick the investment process one by one, or to interpret the investment process through rigorous data operations. This is a very sophisticated and complicated work, and its workload is relatively large.

Secondly, the strategy biased towards technical analysis will also encounter a second problem similar to the fundamental analysis, which is the question of how many samples are needed for historical data testing.
For example, if the strategy based on technical analysis is applied to all publicly traded stocks of NYSE, then the basic data may be more than billion . If further calculations are made, then the total The amount of data is amazing. The data is put into the rules of the strategy to test, the difficulty level and workload can be imagined. Although this test method is the most comprehensive and accurate, no individual will pay for it.
More articles, please see "English version index"
3.3.3 策略的检验方法(3)
(接上文)
偏向于技术分析的策略
当交易者制订了偏向于技术分析的策略后,同样也面对和“偏向于基本面分析的策略”相类似的问题。只是二者细节上有些不同。
当交易者制定了偏向于技术分析的策略后,第一个需要着手解决的问题同样是,如何方便的把符合条件的样本从历史的数据中找出来。
这里我们假设交易者的策略是:10日平均价格从下跌转入上升买入,10日平均价格由上升转入下跌卖出。
当交易者浏览利多机械(本文虚拟的公司)的相关历史数据时,就会碰到该公司的股票价格波动过程中,有大量的符合该条件的数据,而且该数据出现是没有时间规律的,因此需要一一挑拣投资过程,或者通过严谨的数据运算判读投资过程,这是一项十分精密而复杂的工作,而且其工作量也比较大。

其次,偏向于技术分析的策略也会碰到类似于偏向于基本面分析的第二个问题,那就是需要多少样本进行历史数据检验的问题。
例如将基于技术分析的策略应用于上海和深圳两个证券交易所所有公开交易的股票,那么可能涉及到的基础数据就超过2000万(截至到2018年底),如果进一步对其计算,那么总的数据量是惊人的。将这些数据在放入到策略的规则中去检验,其困难程度和工作量可想而知。虽然这种检验方法最为全面和准确,但是也没有个人会在这方面付出。
更多文章,请浏览“中文版目录”
2018年12月5日星期三
3.3.2 Inspection strategy (2)
(... continued)
When a trader browses the historical data of Lido Machinery (the virtual company of this article), it will be more convenient to find out at which stage the stock has a P/E ratio between 15 and 25. Since this data is generally reflected in the company's financial reports, it is necessary to look at the financial reports for the past quarter, half year and full year for several years. This work is very laborious and time consuming. After finding the eligible data in a large number of reports, it is necessary to link the data to the price fluctuations of the stock, which is a very time-consuming and laborious task.
Another issue that traders need to address is how much the sample size for historical data testing should be appropriate.
There are two extremes in the choice of sample size: one is to select the largest number of samples as much as possible; the other is to select only one or two samples. By describing the pros and cons of the two extreme conditions, traders can better grasp the appropriate workload.

As many samples as possible will make the trading strategy fully tested by historical data, but its workload is very difficult for individuals. Think about it, if independent traders face financial reports from more than 3,000 listed companies for several years, this will be a huge workload. Even if there is perseverance to collect these reports and test them, the market and many stocks may have changed a lot.
If the sample is only selected one or two, although it will be very easy to pass the historical data test, it is only a great chance that the test results can prove the universality and reliability of the strategy.
(to be continued)
For more articles, please browse "English version index"
3.3.2 策略的检验方法(2)
(接上文)
当交易者浏览利多机械(本文虚拟的公司)的相关历史数据时,就会碰到如何比较方便的找出该股票在哪些阶段其市盈率介于15至25之间。由于这种数据一般体现在公司的财务报告中,那么就必须对若干年来的季度、半年和全年的财务报告逐项翻看,这项工作是十分费力和耗时的。在大量的报告中找出符合条件的数据后,接下来还需将这些数据同该股票的价格波动进行联系,这又是一项十分耗时费力的工作。
交易者需要着手解决的另一个问题就是,进行历史数据检验的样本数量到底该选择多少合适。
样本数量的选择有两种极端:一种是尽可能选取最多数量的样本;一种是只选择一到两个样本。通过对两种极端状况的利弊描述,交易者可以较好把握适当的工作量。

尽可能多的样本多固然会使交易策略得到历史数据的充分检验,但是其工作量对于个人而言是很难胜任的。想想看,如果独立交易者面对3000多家上市公司若干年的财务报告,这将是一件浩瀚的工作量。即使有毅力将这些报告数据采集完毕加以检验,市场以及很多股票可能又已经发生了很大变化。
如果样本只选择一到两个,虽然通过历史数据检验会变得十分轻松,只是这种检验结果具有极大的偶然性,无法证明策略的普遍性和可靠性。
(待续)
更多文章,请浏览“中文版目录”
2018年12月3日星期一
Comparison of strengths and weaknesses of stocks in China mainland in November 2018.
Comparison of strengths and weaknesses of stocks in China mainland in November 2018.


2018年12月2日星期日
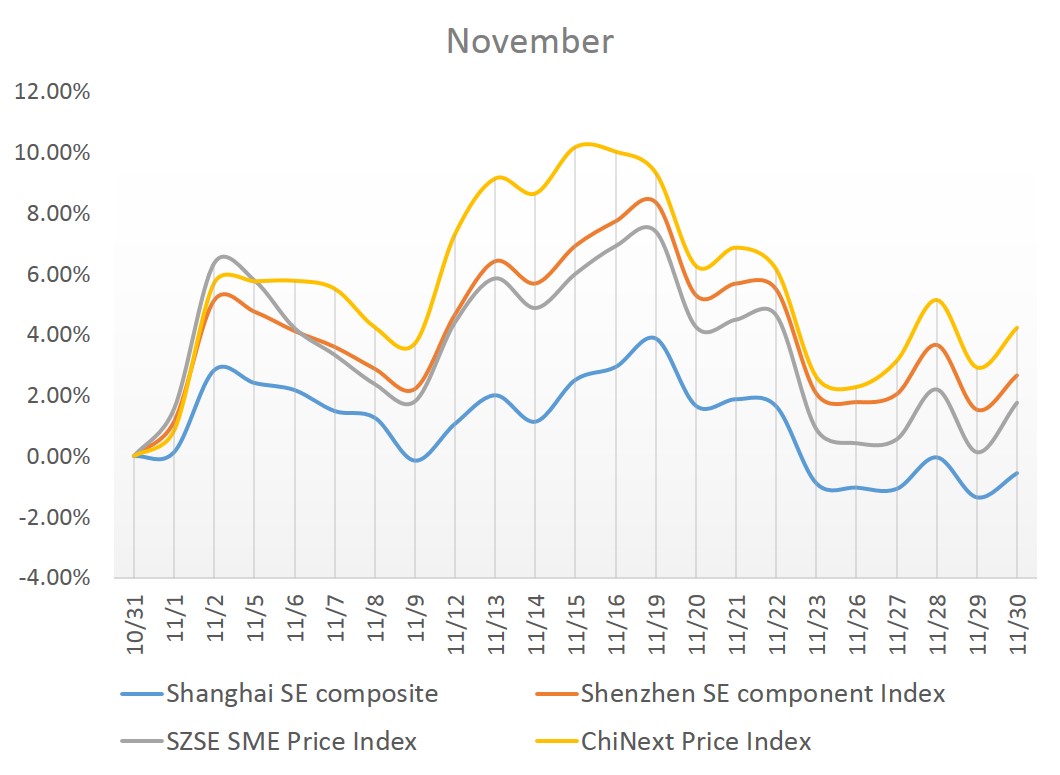
Market fluctuations in China's mainland stock market in November 2018
November 2018
Market fluctuations in China's mainland stock market

Market fluctuations in China's mainland stock market


订阅:
博文 (Atom)
4.0 Observing Object Conversion - Observing Self (1)
As of now, the articles focus on the things outside the trader's own: concepts, propositions, strategies, and so on. These contents are ...

-
 每一个交易者在从事交易的历史中,都有一个十分重要的时间点: 第一单交易的那一个时刻。 只是随着时间的推移,交易者已经淡忘了那个时间点。本系列的文章,将以此时刻为出发点,一步步展开讨论。 交易者应该经常去反思那个关键时刻,经常问问自己: 在第一单交易前的...
 -
 我们在价格是如何波动的文章中提到,影响价格波动的是持有股票或现金,但是交易委托单还没有提交的交易者。 其中持有现金的这部分交易者,会影响价格向上方波动;而持有股票的这部分交易者,会影响价格向下方波动。 我们接下来再看一看具体的情况。 【例】 我们着重看一下,...
